Spotfire Ideas Portal

Custom shapes should be allowed for use in in scatterplots as the current shape dictionary is very limited and does not allow for nice customizations when building a public interest dashboard.
More critically, scatterplot visualizations can be manipulated to create many other useful viz like hex tile map.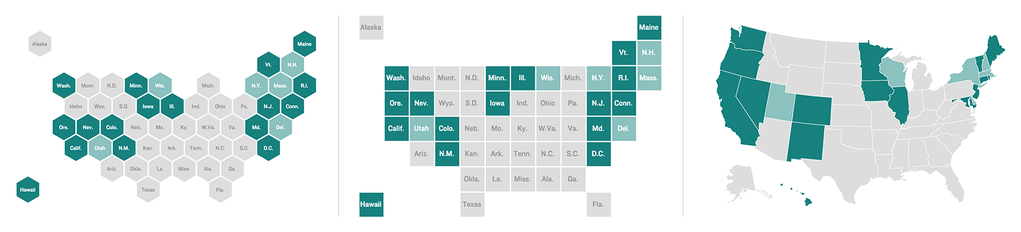
Using the current options I can create the middle map but not left map. Hex tile maps are visually better than regular maps as they encode color information better.
The other useful custom shapes can be domain specific like for online platform analytics the shapes can be : mobile icon, tablet, PC icon. This will reduce the cognitive load in user mapping going to and from between visualization area and legend.